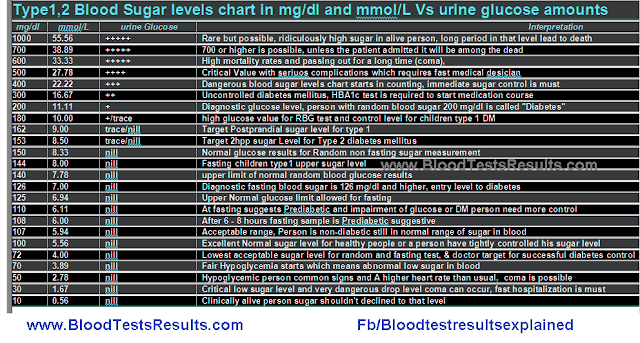
How to use blood sugar levels map to diagnose diabetes for healthy person?
Repeated over limit glucose levels especially fasting blood glucose test diagnose diabetes mellitus.
Normal Level ranges from 70 to 107 mg/dl or 4.0 to 5.9 mmol/l
Prediabetes or Impaired Glucose Glycemia patients exhibit sugar levels results ranges from108 to 126 mg/dl or 6.0 to 6.9 mmol/l in their blood
Normal Level ranges from 70 to 107 mg/dl or 4.0 to 5.9 mmol/l
Prediabetes or Impaired Glucose Glycemia patients exhibit sugar levels results ranges from108 to 126 mg/dl or 6.0 to 6.9 mmol/l in their blood
Diabetes mellitus diagnosed when sugar levels over 6.9 mmol/l (126 mg/dl)Confirm fasting and 2hpp glucose testing is common in today's labs especially using glucose tolerance test which measures how body can metabolize 75g of glucose within 2 hours, the results used to estimate the body's ability to tolerate glucose levels, high GTT results means impaired glucose tolerance condition.
Glucose tolerance test results Normal level of GTT under 140 mg/dl or 7.8 mmol/L
7.9 to 11.1 mmol/l (141 to 200 mg/dl) considered Prediabetes or Impaired Glucose Tolerance
GTT results greater than 11.1 mmol/l (200 mg/dl) confirm diabetes.
Previous article has discussed GTT results more.
7.9 to 11.1 mmol/l (141 to 200 mg/dl) considered Prediabetes or Impaired Glucose Tolerance
GTT results greater than 11.1 mmol/l (200 mg/dl) confirm diabetes.
Previous article has discussed GTT results more.
HbA1c test for monitoring diabetes progress
Hb stands for hemoglobin, a red pigment which is the oxygen-carbon dioxide carrier molecule in the red blood cells
HbA1c test measures the amount of Hb linked to glucose in the past 120 days (which is the average RBC age in the circulation)
HbA1c test measures the amount of Hb linked to glucose in the past 120 days (which is the average RBC age in the circulation)
Glycosylated Hemoglobin (synonyms include A1C, GHb, Glycohemoglobin, HBA1)
Prolonged blood glucose elevation causes a greater percentage of RBCs to become saturated with glucose (glycohemoglobin).
Must assessed two times per year for patients with type 2 diabetes not on insulin and four times per year for patients with type 1 or 2 diabetes on insulin.
Prolonged blood glucose elevation causes a greater percentage of RBCs to become saturated with glucose (glycohemoglobin).
Must assessed two times per year for patients with type 2 diabetes not on insulin and four times per year for patients with type 1 or 2 diabetes on insulin.
HbA1c levels table and corresponding desirable Blood sugar levels chart
| HbA1c | Ave. Blood Glucose | ||
| (%) | (mmol/mol) | (mmol/L) | mg/dl |
| 13 | 119 | 18 | 324 |
| 12 | 108 | 17 | 306 |
| 11 | 97 | 15 | 270 |
| 10 | 86 | 13 | 234 |
| 9 | 75 | 12 | 216 |
| 8 | 64 | 10 | 180 |
| 7 | 53 | 8 | 144 |
| 6 | 42 | 7 | 126 |
| 5 | 31 | 5 | 90 |
Go to>>complete Blood Sugar Levels Chart
Targets for HbA1c and results interpretation:
The Normal HbA1c range is 20-41 mmol/mol (4-5.9%) for healthy people not suffering from diabetes mellitus
Prediabetes persons expect HbA1c range from 5.7& and up to 6.4 %
For people with diabetes; good control is when HbA1c level reaches 6.5% which is 48 mmol/mol or closer to that of non-diabetics persons
Diabetic persons at higher risk of hypoglycemia their HbA1c should adjust glycated Hb level to 7.5% i.e. 59 mmol/molOther HbA1c level charts sometimes reported as:
Nondiabetic: 5%
Diabetes well controlled: 2.5–6%
Diabetes not well controlled: 8%
 |
| Hyperglycemia chart and hypoglycemia chart |
Special Transient high sugar levels explained:Can pregnancy cause high blood sugar?
Pregnant women have either a real abnormal sugar levels which is gestational diabetes or fake high sugar during pregnancy which is transient diabetes insipidus (due to pituitary or renal problems or placental causes), Studies found that pregnant women which have seen with diabetes insipidus during pregnancy course will go on to type 2 diabetes after a decade or so.
Pregnant women have either a real abnormal sugar levels which is gestational diabetes or fake high sugar during pregnancy which is transient diabetes insipidus (due to pituitary or renal problems or placental causes), Studies found that pregnant women which have seen with diabetes insipidus during pregnancy course will go on to type 2 diabetes after a decade or so.
Can seizure cause high blood sugar?
Seizures is a sudden attack of illness, especially a stroke or an epileptic fit.
Seizures is a sudden attack of illness, especially a stroke or an epileptic fit.
Seizures commonly cause transient hyperglycemia because it can activate sympathetic nervous system which largely secrete surges of epinephrine and cortisone which starts lipolysis and glycogenolysis from liver and gluconeogenesis as well, in addition to inhibition of insulin production from pancreas which reduce cells uptake , all these process highly elevate sugar in the blood, shortly after nervous system calm down, all body process act to lower sugar level until it back to normal.
Ketone bodies or acetone occur mainly with type 1 diabetes due to uncontrolled sugar level, there is no enough insulin for high amount of glucose in blood, the body have a problem of lack energy in cells, body start degrading fats and proteins to gather energy, waste products of that metabolized glucose-alternatives are Acetone and AcetoAcetate or so called Ketone bodies, Acetone in urine has a distinct smell, Fruity odor on breath and complicate hyperglycemia to Difficult breathing, Nausea, vomiting, or abdominal pain, and Dry or flushed skin
More publications continue to come, subscribe by email or through Fb, G+ page to get updates...
