A1C chart is a better method to understand the meaning of A1c blood test results.
Because most diabetic people have to monitor their blood glucose levels periodically, and to ease their understanding of a1c reading,
all in one place, we present ready calculated a1c charts between the palm of your hands, you can read on mobiles or handle a printable chart as much as the size of your hand.
Don't be confused, Hemoglobin A1c test is different from Hemoglobin test that's is a part of complete blood count test.
HGB Levels Chart by Age and Diabetes
If we can say that the hemoglobin A1c represents the saturation percentage of red blood cells with sugar particles,
therefore the hgb A1c% results must be directly proportional to the diabetes severity.
Sorting all hemoglobin (Hgb) A1c levels for each diabetic condition based on DCCT formula (Diabetes Control and Complications Trial).
Normal A1c Levels Chart for Non-Diabetes
According to American Diabetes Association latest guidelines 2017 and 2018,
Hemoglobin A1c levels 3, 4, 5, and up to 5.7 is normal and tell that the person has no DM.
"Non-diabetes" means your blood glucose test results are within the expected normal limits for healthy persons.
The normal hemoglobin A1c means you're not diabetic or you are on the goal levels, I mean that:
A1c 4.0% and A1c 5.0 means you weren't diabetic and this value is the normal levels that all healthy persons must have.
But A1c 5.7% means you are on the last step before prediabetes stage.
Hemoglobin A1C Chart for prediabetes
From the ADA latest guidelines, The levels of hemoglobin A1c from 5.8 and less than 6.5 means the person is more likely to develop diabetes mellitus.
HGB A1C chart for Diabetes
Contains the levels of A1c that considered high for people suffering from DM patients whose treatment based on metformin or insulin.
Any reading of A1c is greater than 6.5 tells you have got DM according to ADA guidelines,
although for people who are already have DM and taking medications the levels from 7 to 8 is the target value they should shoot for.
However persons with type 1 DM and are on insulin especially children may show A1c levels over 10,
and they must fight to lower their Hgb a1c levels to theee goal targets.
Two consecutive tests show high A1c levels confirm the diagnosis of DM and means that the person has diabetes millitus type 2 or type 1.
For a person on metformin and A1c 7% it means he achieved the target value for type 2 diabetes mellitus.
However, for type 1 diabetes millitus and persons taking insulin to control DM the A1c 8.0 is mild as all his results may hit the A1c 12%.
Target Hb A1c Levels Chart
Non-Diabetes must have A1c test results less than 6, while Diabetes people should shoot for less than 6.5,
also less than 8 is a good DM control, but any A1c reading above the 8 levels represents uncontrolled DM.
[caption id="attachment_1071" align="alignnone" width="366"]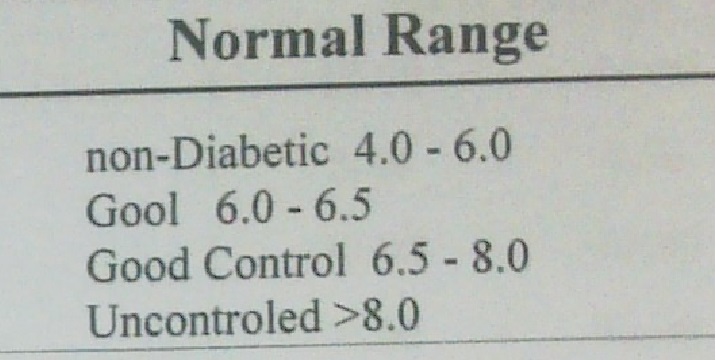
Control A1c Levels for children and adolescents
A1C goal levels chart for children and adolescents with type 1 diabetes and average Serum glucose levels.
A1c goal to be less than 7.5% (58 mmol/mol).
Blood glucose before meals to be 90–130 mg/dL (5.0–7.2 mmol/L)
Glucose level at bedtime/overnight to be 90–150 mg/dL (5.0–8.3 mmol/L).
These goals should be modified to a lower goal (,7.0% [53 mmol/mol]) in children with frequent hypoglycemia or hypoglycemia unawareness.
It's helpful to individualize these goals under benefit-risk assessment to assess preprandial insulin doses in those on basal-bolus or pump regimens.
A1c Levels Chart for Pregnancy
A reasonable A1C goal for many nonpregnant adults is ,7% (53 mmol/mol).
For type 1,2 preexisting diabetes (preconception), it's safe to reduce A1C below 6.5% (48 mmol/mol), to minimize the risk of congenital anomalies.
Management of Diabetes during Pregnancy,
Accelerated red blood cell turnover is the reason behind decreased A1C in normal pregnant women than in normal nonpregnant women.
The A1C target level in pregnancy is 6–6.5% (42–48 mmol/mol).
Optimal A1c level during pregnancy:
It is 6% (42 mmol/mol) if this can be achieved without significant hypoglycemia, but the doctors may target A1c 7% (53 mmol/mol) to prevent hypoglycemia in pregnancy.
In the second and third trimesters:
To hit the lowest risk of large-for-gestational-age infants doctors must target A1C 6% (42 mmol/mol) ,
because studies shown that 6.5% (48mmol/mol) is related to increased adverse outcomes.
Blood sugar target levels during pregnancy:
The American College of Obstetricians and Gynecologists as well as the ADA-recommended targets for women with type 1 or type 2 diabetes as follows:
- Fasting #95 mg/dL (5.3 mmol/L) and either
- One-hour postprandial #140 mg/dL (7.8 mmol/L) or
- Two-hour postprandial #120 mg/dL (6.7 mmol/L)
Read about: Pregnancy blood test results
Blood Hemoglobin A1C Conversion
After the international A1C-Derived Average Glucose (ADAG) study to show the correlation between A1c results and average blood glucose, we deliver a ready-to-download charts and tables.
Charts to tell how much blood sugar was during the last 3 months depending on how much is your hemoglobin A1c values in the diabetes blood test results.
Measuring units used here:
- mg/dl is a short code for milligrams per deciliter and means how many milligrams of sugar is inside each 100 milliliter of your blood.
- mmol/L is a short code for millimoles per liter and means how many millimoles of sugar is inside each liter of your blood.
Hemoglobin A1c Formula
To know how to calculate A1c and eAG simply use these mathematical equations which are used by the laboratory professionals to calculate the average blood glucose from A1c percentage and vise versa.
[caption id="attachment_1072" align="alignright" width="146"]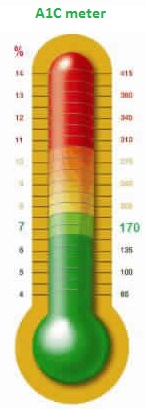
Conversion of A1c = (46.7 +Plasma Glucose) / 28.7
Conversion of Plasma Glucose = (28.7 * HbA1c) - 46.7
eAG in mg/dl = (35.6 × HbA1C)-77.3 or
eAG in mmol/l=(1.98×HbA1C)-4.29
The correlation of the equation results needs more details which will be added, continue reading please.
Here's two ready made eAG values from A1c calculation in two measuring units of sugar monitors.
HGB A1C chart for conversion to average blood sugar in mg/dl
Ready calculated average blood sugar readings from the values of A1c to facilitate following-up your eAG level anytime.
| A1C reading | Estimated average blood sugar level in mg/dl |
| 5 percent | 97 mg/dL |
| 6 percent | 126 mg/dL |
| 7 percent | 154 mg/dL |
| 8 percent | 183 mg/dL |
| 9 percent | 212 mg/dL |
| 10 percent | 240 mg/dL |
| 11 percent | 269 mg/dL |
| 12 percent | 298 mg/dL |
| 13 percent | 326 mg/dL |
| 14 percent | 355 mg/dL |
Hemoglobin A1C chart for conversion to average blood sugar in mmol/L
We calculate the average blood sugar values from all the A1c readings and give them to you ready-made inside this wallet sized A1c chart.
| A1C reading | Estimated average blood sugar by mmol/L |
| 5 percent | 5.4 mmol/L |
| 6 percent | 7 mmol/L |
| 7 percent | 8.5 mmol/L |
| 8 percent | 10.2 mmol/L |
| 9 percent | 11.8 mmol/L |
| 10 percent | 13.3 mmol/L |
| 11 percent | 14.9 mmol/L |
| 12 percent | 16.5 mmol/L |
| 13 percent | 18.1 mmol/L |
| 14 percent | 19.7 mmol/L |
eAG/A1C Levels Conversion Calculator
Here's a chart for Pre-calculated levels but remember that the small fraction isn't really important because we measure the A1c over 3 months which is a long period, isn't it?
[caption id="attachment_1074" align="alignnone" width="581"]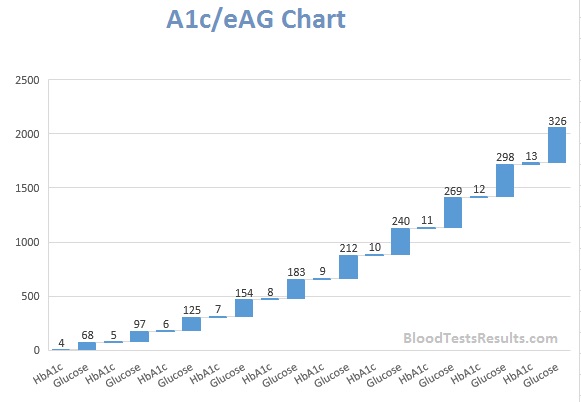
A1C to eAG from American Diabetes Association latest guidelines
[caption id="attachment_1075" align="alignnone" width="1018"]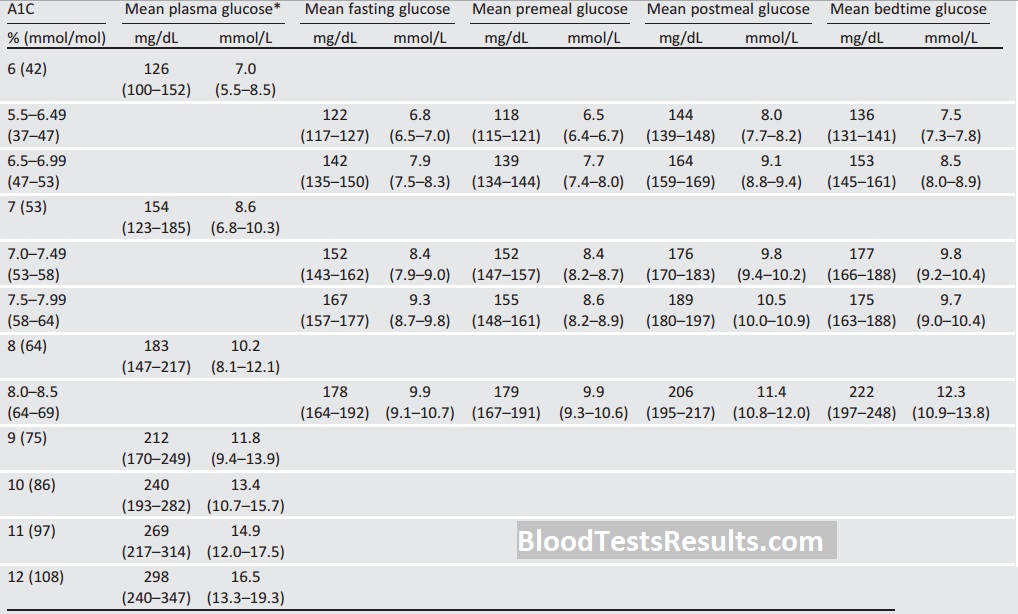
http://diabetes.org/ [/caption]
Conclusion:
Discussing hemoglobin A1C levels from perspective of medical laboratory into usable A1c chart forms.
A1C test is a better marker of how well your diabetes treatment plan is working.
Subscribe and follow to get free explanations for your blood test results.
